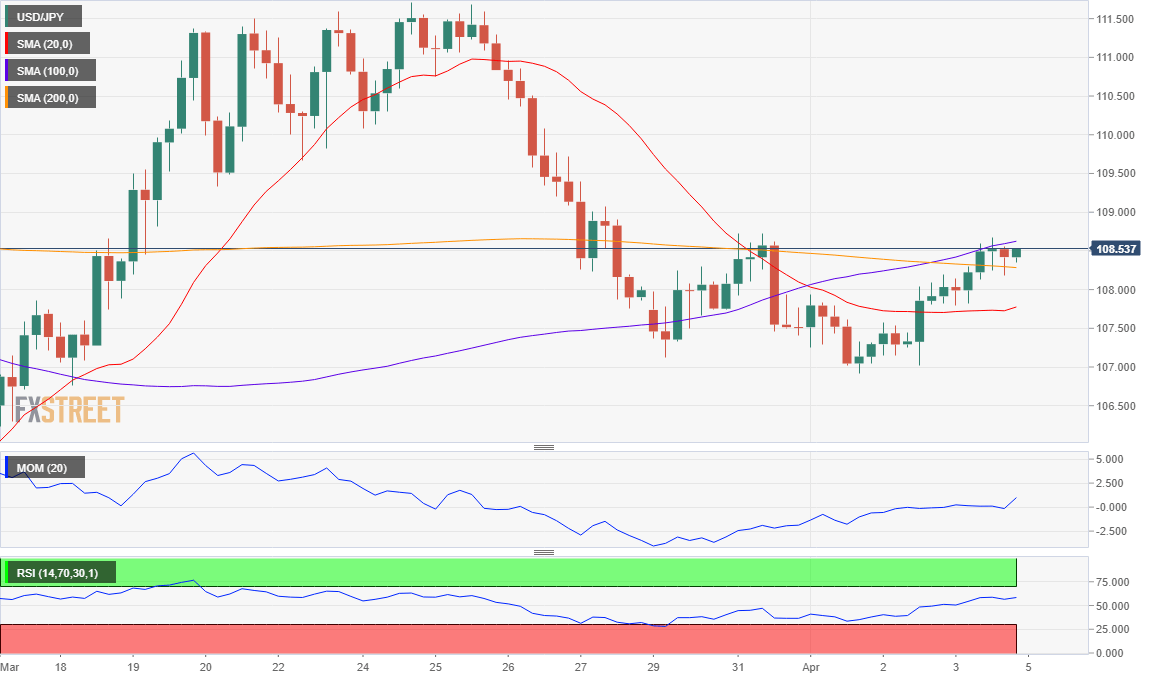
USD/JPY Current Price: 108.53
- The Japanese yen lost ground despite the dominant-negative market’s mood.
- Equities fell on Friday, US government bond yields closed the week in the red.
- USD/JPY offers a neutral-to-bullish stance, could accelerate its advance once above 109.20.
The USD/JPY pair advanced for a second consecutive day on Friday, to close the week with modest gains at around 108.35. The pair advanced on persistent dollar’s demand and despite the sour sentiment that dominated financial markets. By the end of the week, equities came under selling pressure, while US Treasury yields lost ground, limiting the bullish potential of USD/JPY.
By the end of the week, Japan released the March Jibun Bank Services PMI, which resulted at 33.8, better than the 32.7 but much worse than the 46.8 from February. The country won’t release macroeconomic data this Monday.
Show navigationFXStreet
![]() Valeria Bednarik
Valeria Bednarik
FXStreet Follow
USD/JPY Forecast: Mildly bullish amid dollar’s strength
ANALYSIS | Published Apr 05, 2020 13:50 (+00:00)
USD/JPY Current Price: 108.53
- The Japanese yen lost ground despite the dominant-negative market’s mood.
- Equities fell on Friday, US government bond yields closed the week in the red.
- USD/JPY offers a neutral-to-bullish stance, could accelerate its advance once above 109.20.

The USD/JPY pair advanced for a second consecutive day on Friday, to close the week with modest gains at around 108.35. The pair advanced on persistent dollar’s demand and despite the sour sentiment that dominated financial markets. By the end of the week, equities came under selling pressure, while US Treasury yields lost ground, limiting the bullish potential of USD/JPY.
By the end of the week, Japan released the March Jibun Bank Services PMI, which resulted at 33.8, better than the 32.7 but much worse than the 46.8 from February. The country won’t release macroeconomic data this Monday.
USD/JPY short-term technical outlook
The daily chart for the USD/JPY pair shows that it settled within directionless moving averages, although above the 38.2% retracement of its latest bullish run. Technical indicators in the mentioned chart have bounced from their midlines, skewing the risk to the upside without confirming it. The pair would need to firm up beyond 109.20, the next Fibonacci resistance level, to be able to extend its advance. In the 4-hour chart, the pair offers a neutral-to-bullish stance, as its holding at the upper end of converging moving averages, while technical indicators are directionless, but above their midlines.
Support levels: 108.00 107.70 107.20
Resistance levels: 108.80 109.20 109.60
Source from https://www.fxstreet.com/analysis/usd-jpy-forecast-mildly-bullish-amid-dollars-strength-202004051350
